2021-01-02: Thoughts on the logging framework
There are many logging libraries in Haskell and choosing the best one to use is usually not an easy task, unless you have clear goals and understanding of what you want and why. In this post, I want to share my view on implementing the logging library, what features should be implemented with care, what should be irrelevant and why. This post may help you to make your way through the existing libraries or introduce your own, or at least learn about my decision-making process. I'll concentrate on the logger for the backend application that is a part of the bigger system, the other areas like desktop software of CLI tools would have other choices.
(This post does not contain much code (or at all) and is for general reading)
The structure is the following: firstly, we will try to set up reasonable goals and decide what we want to achieve with logging. Then we will discuss some possible solutions, ground requirement and possible implementation. Then we will talk about structuring the messages and possible solutions there. And at last, I'll try to sell you my solution.
Current state
To learn the Haskell ecosystem's state of logging libraries, you can watch this great talk by Vitaliy Bragilevsky. The talk happened in 2018, but I think everything there is still relevant at the start of 2021, at least no innovation had happened (we have open-sourced our libraries, but it's not an innovation)
Why do we need logging?
But even if you know all the libraries, how to decide what you need from the library?
To understand what you need from the logging, you should answer some questions. The first one is why do you need logging? The question looks obvious, but really it's not. Especially if you extending the question as long as you give answers. Usual answers are: to watch what is going on with the service in runtime, debug existing problems, and prevent problems that could happen. But depending on the answers you can understand how detailed your logs should be, how long do you need to store them, do you need to aggregate logs from the different applications at the same place.
For the server applications, usual answers are that you need a detailed log of the main operations, you need to keep them for a long from searchable hot searches should work about a month, and cold from half a year and more. Depending on how fast applications evolve, long-living logs may not be required; all longs living information should live in DB or replicated log. To debug the distributed system issue, especially after the issue had happened, it's required to keep logs in ELK, Graylog, or some cloud solution like StackDriver. These solutions introduce logs indexing. With these indices, you can search and filter the relevant logs very fast making a horizontal (all logs from the given service at a certain time) or vertical (logs across all the services associated with a given request). So the logging library should provide enough means for log aggregators to do their job. Besides, you can extract relevant logs, build aggregations, and emit alerts based on such logs.
What should we log?
To have all of that, we need to log the data in a structured format. The log aggregation engine should support this format; usually, it's JSON — very lightweight untyped format. So you can easily change the structure on the flight. It can be viewed from the positive or the negative side though usually it just works. When logs are structured you can tag your data with additional information, for example here we add the id of the thread, severity and the user_id
{ "message": "your message"
, "severity": "debug"
, "data":
    { "user_id": "2332420123"
    }
, "thread_id": 123
, "namespace": "application.server.action1"
}
Later the ELK will build the indices, and I can easily request all debug messages associated with the user_id: 2332420123 across the cluster find this one, and then request all messages associated with the thread_id: 123 to see everything that happened with this request.
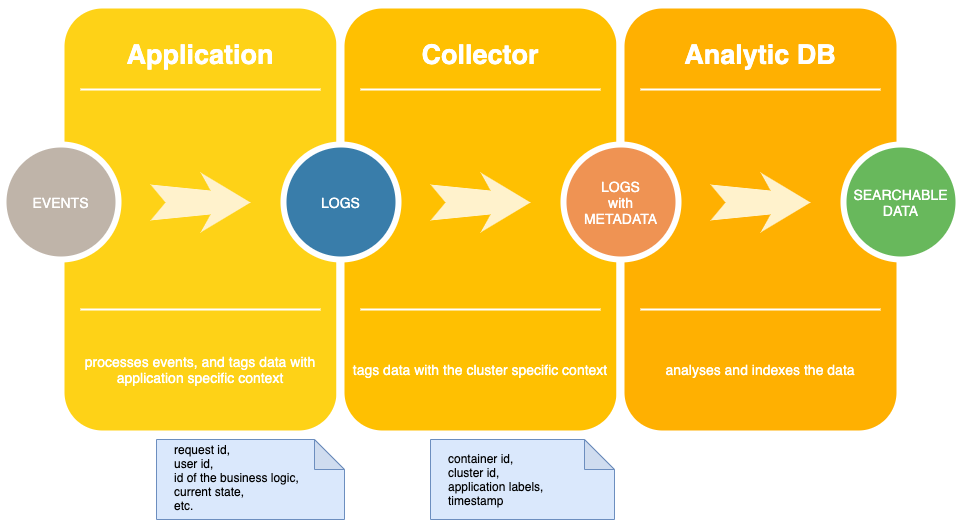
Now let's discuss a pipeline. The application pipes the logs out to the collector, collects pre-processes, and pushes the aggregator in reasonable chunks. Later, the aggregator processes them, so they become searchable.
Theoretically, you can send messages directly to the aggregator. Still, it could lead to several complexities: firstly you'll commit to a particular technology, secondly pushing the tasks over the network is not a simple task you would have to deal with aggregation sending messages in reasonable chunks, surviving network outages etc. And this is a complex piece of software you'd likely not want to embed in the system. It's easy to offload the task to the special software in my case it's filebeat.
We could think what each part of the pipeline "should know", I like to use this term to tell the concrete things an entity can operate on, and the other can remain abstract. In this case, the logger should be told only business logic information and possibly some RTS info (like the current thread id), the logger should not know the application name, labels, whether it's running in debug or production mode, it should not know host IP, user name etc. These are not a collection of the random knowledge this is what some logging frameworks actually tries to add to the message. All that information can be attached to the logging collector's message that can do it much more efficiently (for example, adding only one time for the pack of messages). Moreover, I think that an application message should not keep current timestamp (and is done by the collector as well whether you want it or not). You may ask how to debug and work with the application without logs collector, for example during development if you don't use full cluster replica or problems with the collector. The answer is simple you can use ts the tool from moreutils to add timestamp locally, you can use kubectl logs —timestamps=true if you watch the logs from the pod directly.
So at this time, the application logger should be very simple:
| it should | it should not |
|---|---|
| emit JSON logs write logs to stdout | add timestamps add colours add weird terminal symbols try to talk over the network with external services (*) filter messages based on its severity (**) |
We will discuss (*) and (**) later as everything throwing that to the "it should not" section is not fair.
How should we log?
Are there any other properties that should hold? I think that yes, ideally logs should be implemented so that their existence does not affect the application. It means that you should add as many logs as you wish without seeing negative effects. Of course, it's not possible, but you can get a nice approximation. For this, the logging process should be fast and effective. Ideally, the logging process should be concurrent, i.e. one thread should not block the other while emitting the logs. There are two common patterns for achieving this goal:
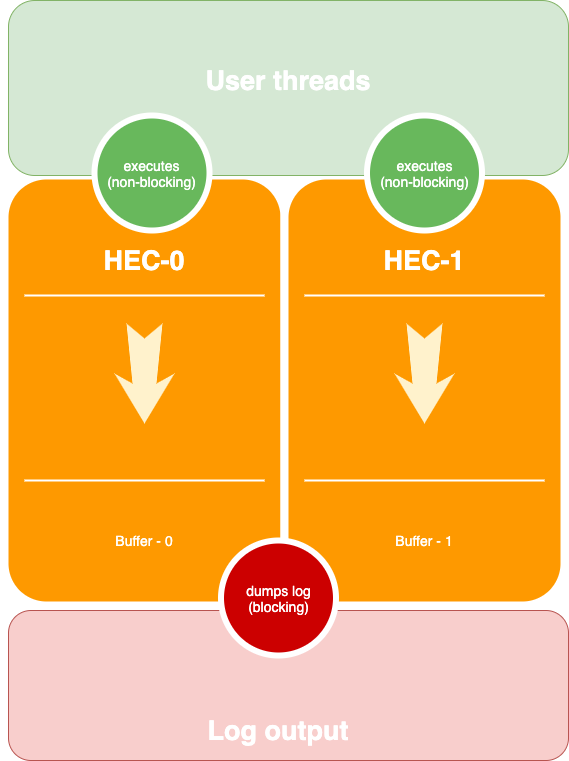
The most sophisticated one is the pattern used in the fast logger. In this pattern, each Haskell execution context (an OS thread) has its log buffer each user thread writes to that buffer in a non-blocking way; it's safe as long as the thread writing the log is not rescheduled at the moment of the log write. Once the buffer is full, it's dumped to the destination in a blocking way, so two HEC's does not interfere.
This should be very fast and sound. However, it has two problems if one HEC starves or threads emit logs unevenly some logs may be dumped much later than the other. This is one point I want to bring attention to that statement that in a distributed system logs should not be viewed as a persisted and stable entity (like another database), they may be lost, reordered or misbehave. If your logs provide better quality, this is good, but not a thing you should rely on, at least in a distributed setting.
Still, this problem may hurt you.
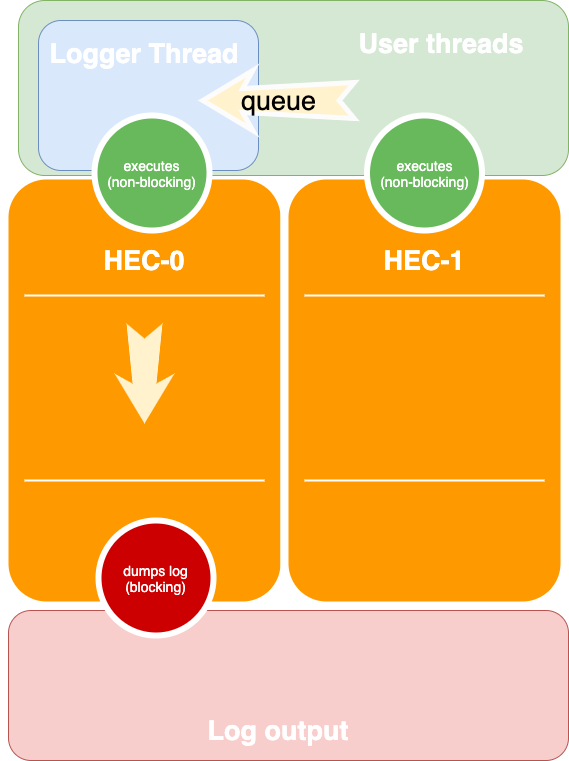
Another pattern is to have a queue or a channel (basic concurrent message-passing structure). With this pattern, we have an explicit logger thread as a user thread. When it's executed, it reads the messages queue and emits them to the output as needed. This pattern may be less efficient, but it guarantees that the same thread's messages will not be reordered. To control memory usage, it's possible to make a thread bounded in this case another user thread trying to write to the full queue will be blocked. But this is an exceptional situation and means that something goes wrong. A few design options on how to make this approach faster put seems that is out of the scope of the post.
With any of those approaches, you can have fast and reliable logging. I'll reiterate that fast logging is an essential thing. You should never think if you can add another log or not, even if your service processed 10k+ messages a second. The only thing you should think if your message aggregation engine will be able to handle that load. But how to make it fast? Ideally, the logger engine should not use memory inefficient types and structures. Those structures should be abstracted away from the user so that they could be improved without user notice. To be more concrete, we could use `builder` to dump data in the intermediate buffer efficiently or directly to the handle. And use efficient structured, for example, it worth not keeping intermediate Data.JSON.Value representation of the JSON message and use Encoder directly.
At this point, we may remember filtering not writing the logs is much faster than writing that and filtering out further. Until you are at google scale, you will have your own tooling you are quite fine with writing all logs and filtering them later. Still, there is a valid use-case when you may want to set your application on the "TRACING" severity level, i.e., when you basically trace all function call (modulo function call definition in the lazy language). That would provide too many logs that you likely do not want to handle anyway. Usually, this level is set on a single service when it's being debugged. But that requires flexible configuration when you can change log level at the runtime for a given component. I don't have that even in plans so not care much, maybe it's wrong though.
So we can fill more things in our table.
| it should | it may not |
|---|---|
| be fast: - use builders to emit data - use efficient data structures | be super-extensible: - provide multiple types to dump data (String, Text) - provide multiple message types to work with |
How to structure logs?
Now we have an understanding ground solution, which will be usable and useful for debugging logs and analytics, the only piece that is missing is how would form each log message.
There are two common approaches:
- Emit entire JSON message. With this approach, you can give your message a type. Define a list of required and optional fields and be sure that the user will not miss anything, or write a nice error message otherwise.
- Keep a context of tags associated with; each layer can add more tags to the context. When the raw message is emitted would have all the tags attached to the context.
| single message | context-based | |
|---|---|---|
| pros | strictly typed good error messages non-composable (w/o explicit conversions) | loosely coupled, each component knows only it's data logs from the components can be composed extensible |
| cons | too coupled | no error messages if structure if wrong |
I really prefer the context-based approach, and this approach is also advertised in ELK documents.
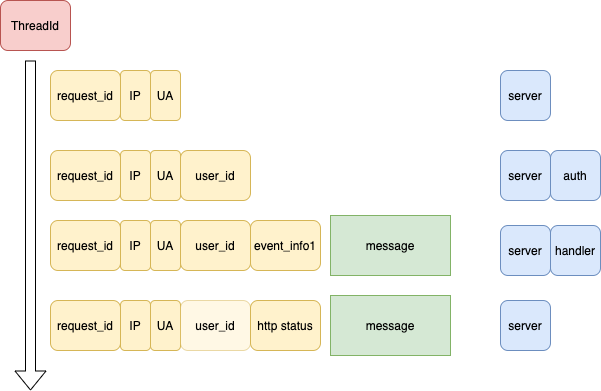
With this approach, we can have something like this. We have a "namespaces" nested components name that resembles call graph (blue boxes). The technical tags added by the log itself (red box). Additional business logic tags nested in each other (yellow boxes). And messages itself (green boxes). The tags are emitted only in case if the message is emitted. So in this example, we would see. There is one half-transparent yellow box; in that case, we provided a tag from the internal context to the other, that may or may not be possible with the framework. Still, if that is possible, it's excellent to reduce the number of messages and keep all the relevant info with the final message about the result. So, in this case, we would have 2 messages emitted:
 { "thread_id": 1
 , "data":
    { "request_id": "123afdhxvxc"
    , "ip": "127.0.0.1"
    , "user_id": "12313"
    }
 , "message": "message1"
 , "namespace": "server.handler"
 },
 { "thread_id": 1
 , "data":
    { "request_id": "123afdhxvxc"
    , "ip": "127.0.0.1"
    , "user_id": "12313"
    , "http": { "status": 200 }
    }
 , "message": "message2"
 , "namespace": "server.handler"
 }
Do we want anything else?
One additional thing that is tags extraction from the message itself, if the message is written using a formatter, then it's possible to put all the values into the tags. There are such solutions in other languages but not in Haskell yet.
Another good to have thing is an ability to use alarm channel in case if something bad happens. For example, in our system, all messages with severity Error are delivered into the relevant telegram channels. To appear there, they should pass the entire log pipeline and elastic-alert do some compaction, so not all messages will appear in case there are too many. For that reason in case of an emergency or critical level we want to send a message directly into the Telegram channel (or `sentry`). This requires logger to add extra handlers on a certain logger level.
The last but not the list nice to have (though in my project I'd say it's required) thing. Is the ability to expose metrics that describe the system behaviour. Without that, you can never be sure if everything is ok. Besides logging system health describes mimics entire system health quite well, if something goes wrong, it's very likely to be reflected in the logging system monitoring.
What can be monitored: the number of lines written, the number of lines flushed, the number of messages in-flight. Together they can tell very much about the system.
| it should | nice to have |
|---|---|
| support hierarchical context support namespaces | extensible handlers automated tags addition expose metrics for monitoring |
So these are considerations that I'm waiting from the good logging system. And I hope you've enjoyed this post.
A few Ads as a bonus ^_^
If you are still reading :). Most of the ideas above were implemented in our library cheops-logger I'm not sure if the public version is ready for the wide use as API needs some polishing. But in general, it consists of:
- co-log-json — provides json output as described above, it has addContext and addNamespace calls to populate the context. In addition it provides an efficient log dump function that uses aeson Encoding to dump messages directly to the file handle.
- co-log-concurrent — provides concurrent background worker that can dump the log messages asynchronously. Implements few optimisation techniques to dump the logs in bulks.
- cheops-logger — glues everything together, allows to have a single line import and start everything using one more line of cod. Provides backpack based API for injecting the metrics.
All the packages has documentation with Readme that targets the basic usage story, and haddocks that target reference documentation and design decisions discussion. So even you don’t use the libraries reading the haddock may help you to build your own ones.
The package works well in k8s, with ELK stack for logs analysis and a prometheus+grafana for metrics, if it’s needed I can provide more info on the setup.
One thing that I should warn that despite the name co-log- name usage both co-log-json and co-log-concurrent are based on the co-log-core package but basically use only LogAction type. So they may be not perfectly compatible with the rest of the co-log ecosystem.